FelisField
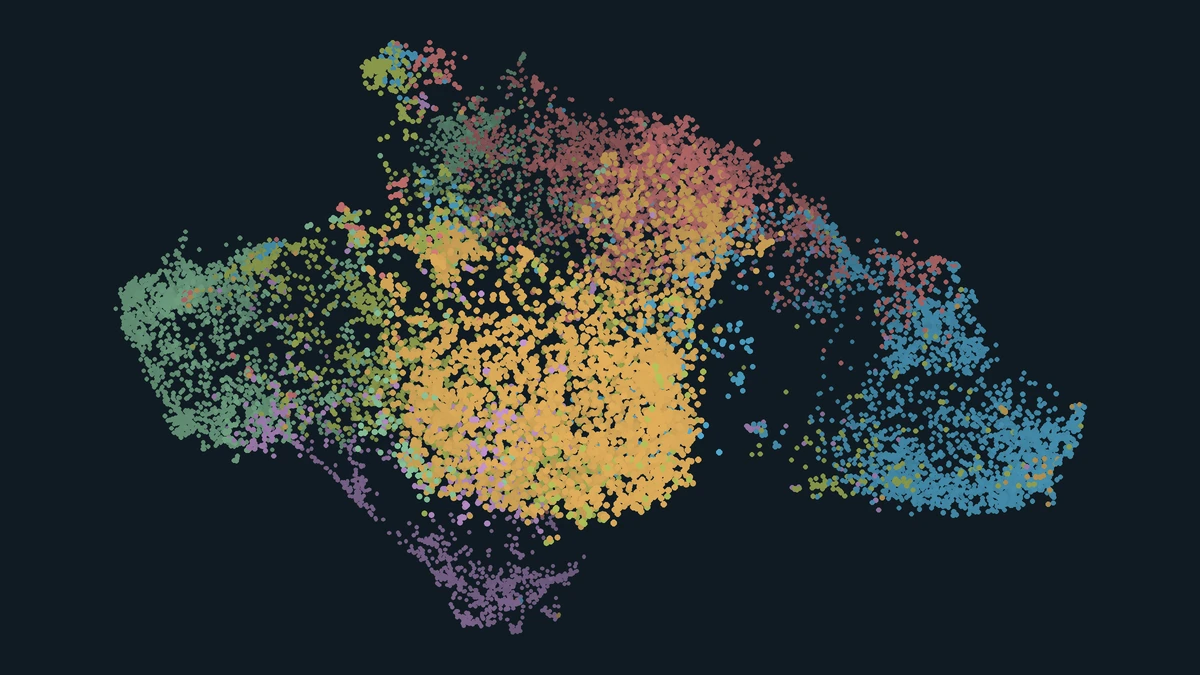
A 3D map of 17,303 cat photographs from six sources. Explore how coat color and other visual features vary from one point to the next.
Explore the map
I built FelisField so you can start with one cat photograph and find others with a similar appearance, even when the photos have no coat-pattern labels. Hover over a point or tap it to see the full photograph beside it. Move to a nearby point to compare coats, drag to rotate the map, or pinch to zoom on a phone. In the Japanese-language demo, 出典・クレジット opens the selected photo’s source and license.
From a photograph to a point
To keep the focus on the cat, I used Mask2Former to estimate its outline in each of 29,046 candidate photos. I kept 17,303 photos that met the detection and size thresholds, using the largest detected cat when a photo contained several. I used these automatically generated masks without reviewing them individually.
For each cat region, I measured the proportion of pixels in each of 64 color bins. This captures how much of each color appears in the region. Two cats with different markings can have similar proportions. To capture other aspects of appearance, I also extracted DINOv2 features from a crop with the background masked out.
I gave the color distribution and the DINOv2 features equal weight. UMAP uses the combined features to position each photograph in 3D. K-means groups the same features into six clusters, shown by the six point colors. The models run offline, so the browser only needs the precomputed map and the photo previews.
How much coat-color similarity survives the 3D projection?
For each photo, I limited the comparison to photos from other sources. From that pool I took the 15 nearest in 3D and drew another 15 at random. For each pair, I compared the proportions in the 64 color bins using Hellinger distance. A distance of zero means the two color distributions are identical.
Mean color distance was 0.462 for map neighbors and 0.689 for randomly selected photos. Because color helped determine the layout, some similarity was expected. The roughly 33% lower mean distance measures how much closer neighbors were in color than the random baseline. This comparison measures color proportions only. It does not test whether stripes or patches occupy similar positions.
Tools & Technologies
Python · PyTorch · Mask2Former · DINOv2 · UMAP · Canvas API