MeowAtlas
An interactive listening atlas for exploring 440 cat vocalizations from 21 cats through a fixed sound map and spectrogram comparison.
Explore by listening
I built MeowAtlas to make a collection of cat vocalizations accessible through listening and visual comparison. It uses 440 recordings from 21 cats in the University of Milan’s CatMeows v1.0.2 dataset.
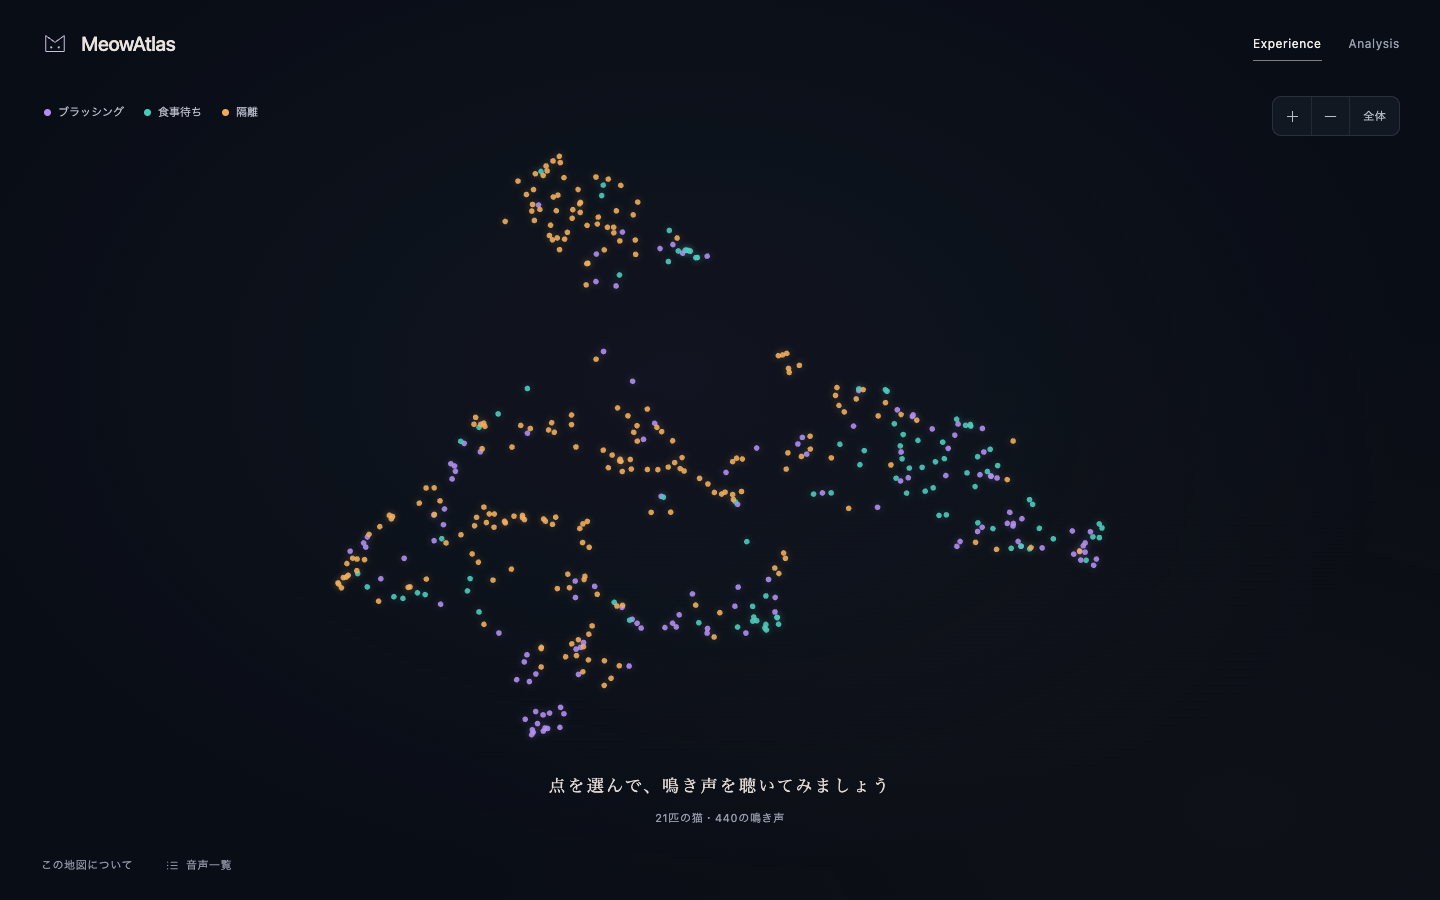
The map gives each recording a fixed position based on its audio features. Visitors can select a point, hear the recording, and explore how nearby and distant examples differ. Colors identify the three recorded situations: brushing, waiting for food, and isolation in an unfamiliar environment.
Two connected views
Experience starts with the map, a brief invitation, and a color legend. Selecting a point plays the recording and reveals a compact cat profile. Visitors can zoom, pan, or browse the recording list.
Analysis supports closer inspection. Visitors choose recordings A and B, play them separately, and compare their spectrograms on shared time and frequency axes. Filters cover individual cats, breed, sex, neutering status, and recording context. Comparison suggestions can follow distances in the original audio features or in the two-dimensional map.
Both pages use the same saved coordinates and carry the selected recording between them. The interface is in Japanese.
From recordings to a fixed map
The offline Python pipeline trims 0.4 seconds from both ends of each recording and applies 0.05-second linear fades, following the preprocessing example in the CatMeows paper. I represented the processed audio with 40-band log-Mel spectrograms, standardized and padded each spectrogram, and used unsupervised UMAP to place the resulting feature vectors in two dimensions.
The adopted map uses 15 neighbors, min_dist=0.1, Euclidean distance, and seed 42. Recording-context labels are not inputs to the embedding, and no artificial coordinate adjustment is applied. Filtering changes which points are visible without recomputing the map.
The browser interface uses JavaScript, Plotly.js, HTML audio, and canvas spectrograms. Audio files, coordinates, and comparison rankings are prepared in advance, so the website runs as static files without an inference server.
What the map can tell us
MeowAtlas supports exploration of these recordings rather than emotion prediction. Recording length, onset timing, background sound, and individual cats affect feature distances. Nearby points need not sound similar, and a visible cluster does not establish a distinct category of cat behavior.
The dataset also does not isolate breed from housing and recording environment. I kept these limits visible in Analysis so visitors can compare the recordings themselves alongside the visualization.
Cat photographs are illustrative images of the same breed, not photographs of the recorded animals. Audio, image sources, transformations, and usage terms are documented in the credits and repository notices.
Tools & Technologies
Python · librosa · UMAP · JavaScript · Plotly.js · HTML Audio · Canvas · GitHub Pages